
Creating a Dashboard
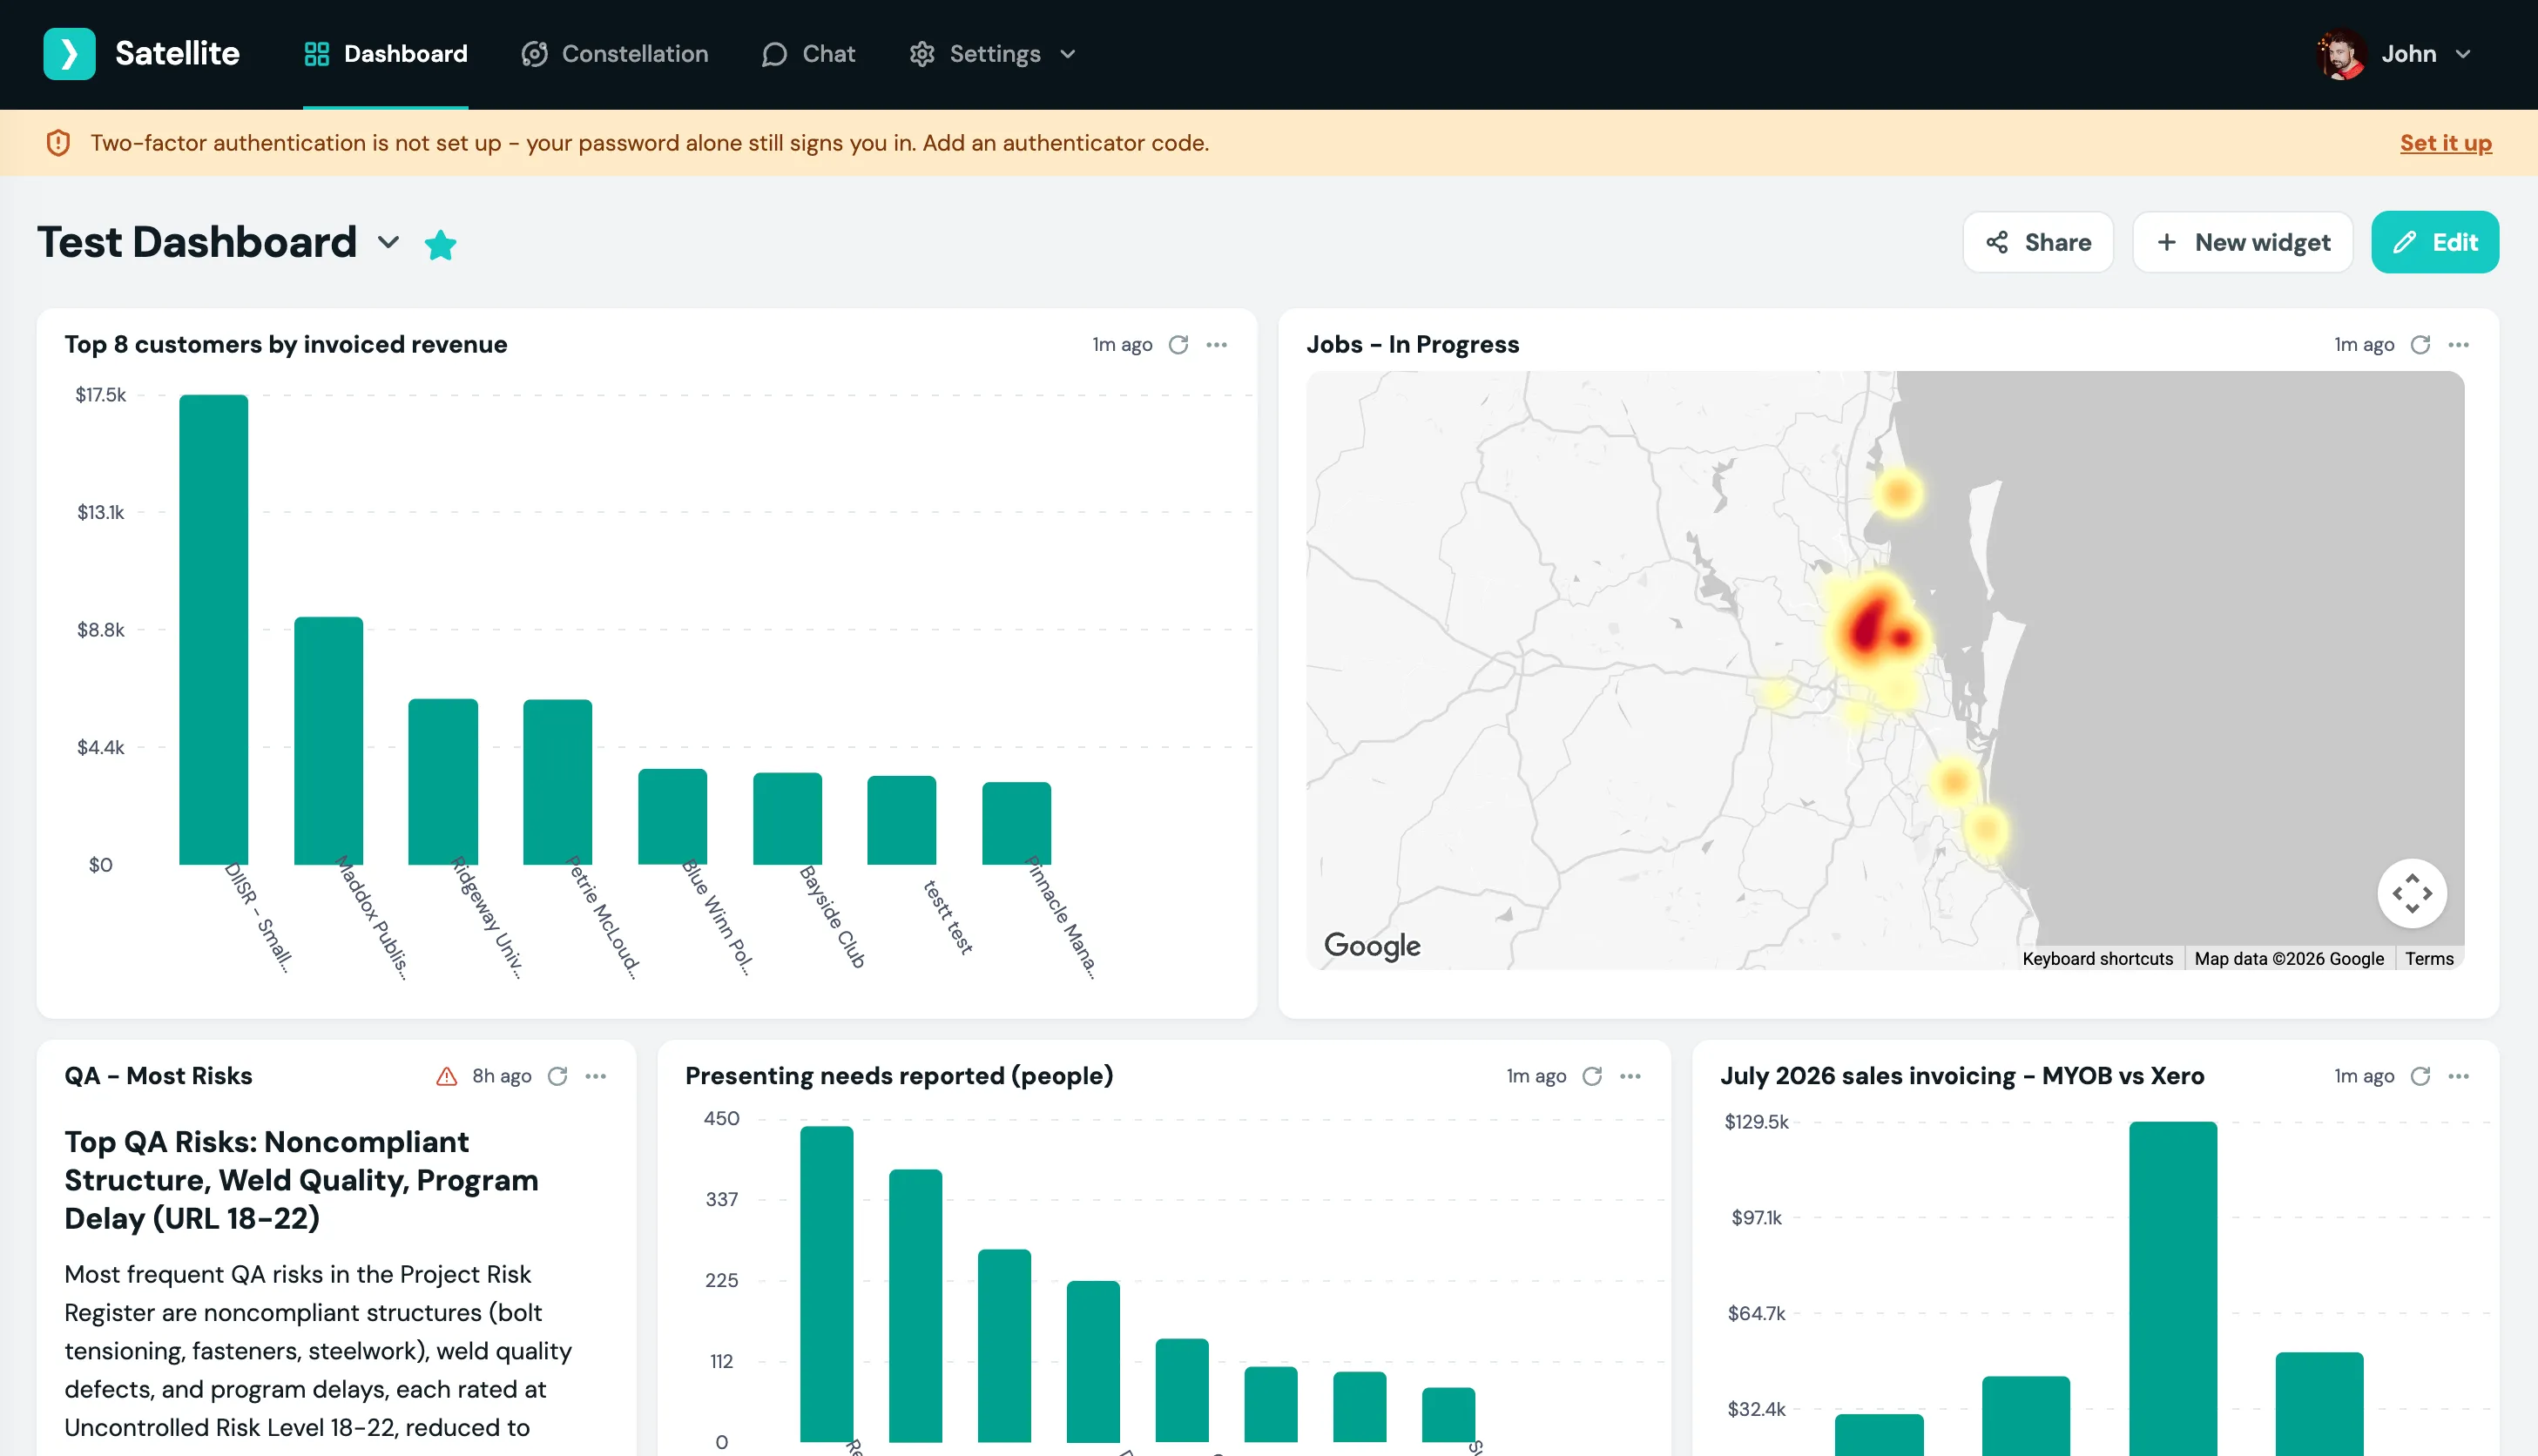
Dashboards hold charts, tables, single figures and AI insights that refresh on their own.
Creating one
Section titled “Creating one”- Open Dashboard.
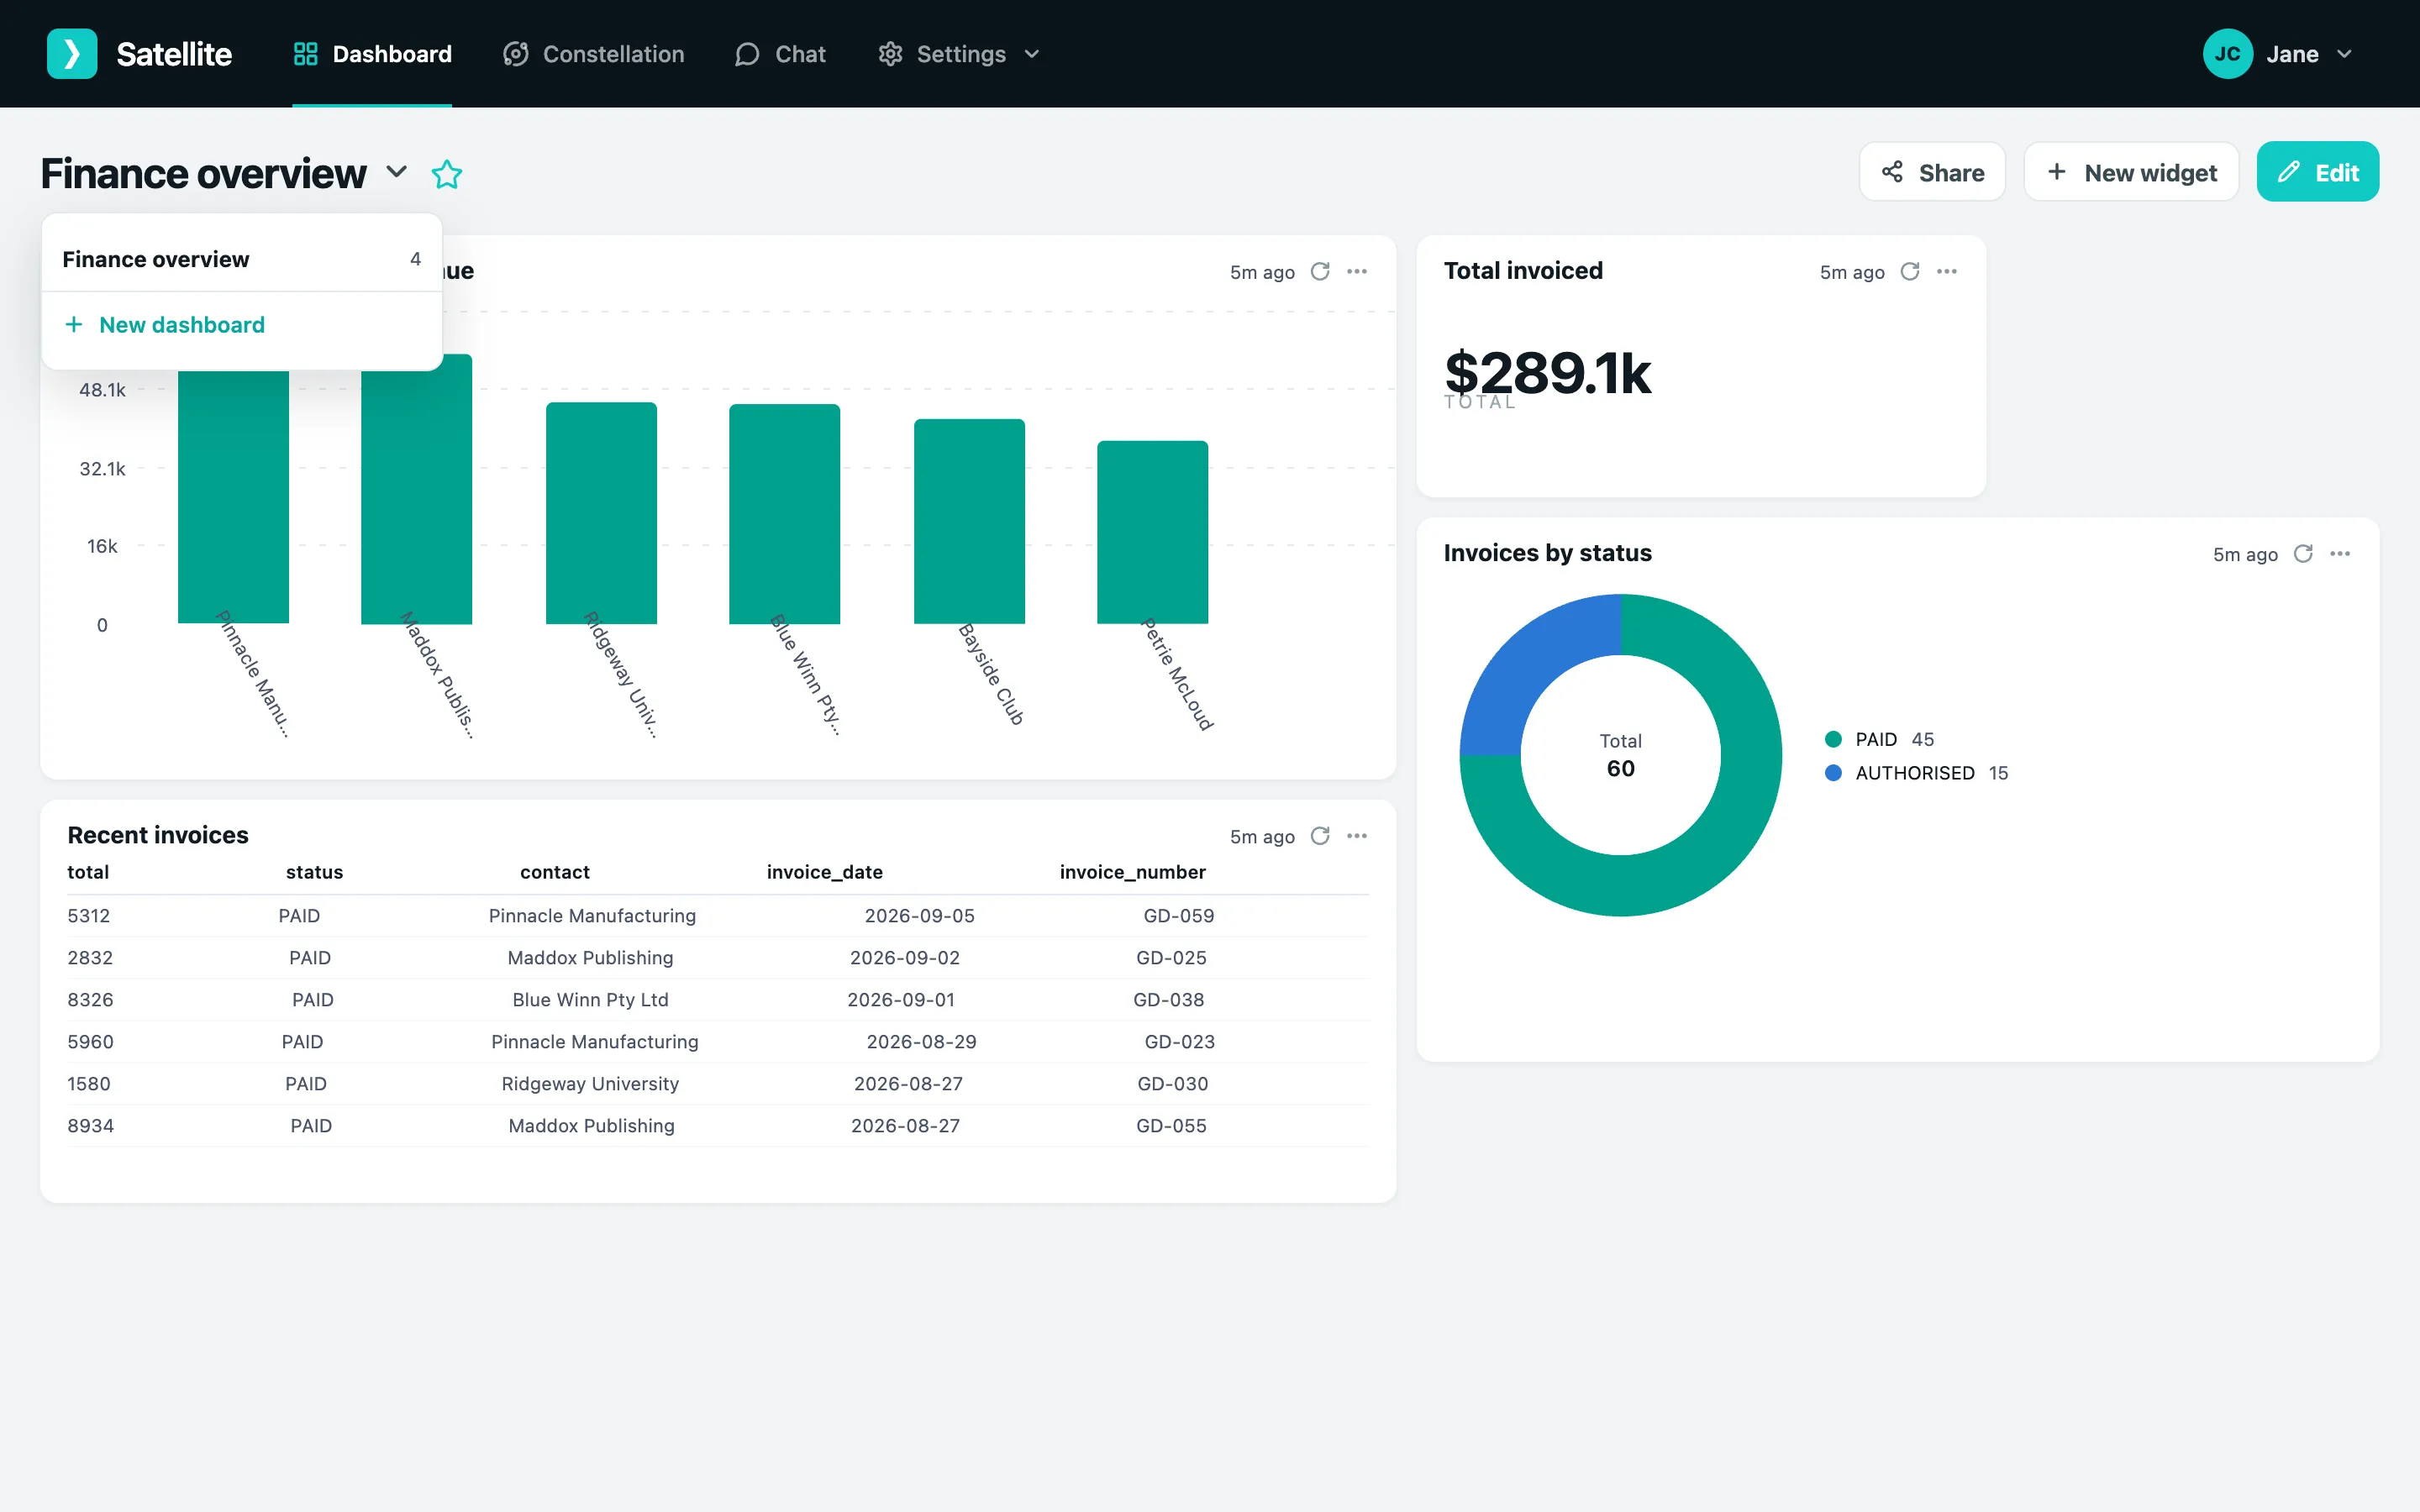
- Click the dashboard name at the top left to open the switcher, then New dashboard.
- Give it a name and click Create dashboard.
Adding widgets
Section titled “Adding widgets”From Chat - the easiest way. Ask for what you want, then click Add to dashboard on the answer. See Asking questions.
By hand - click New widget on the dashboard:
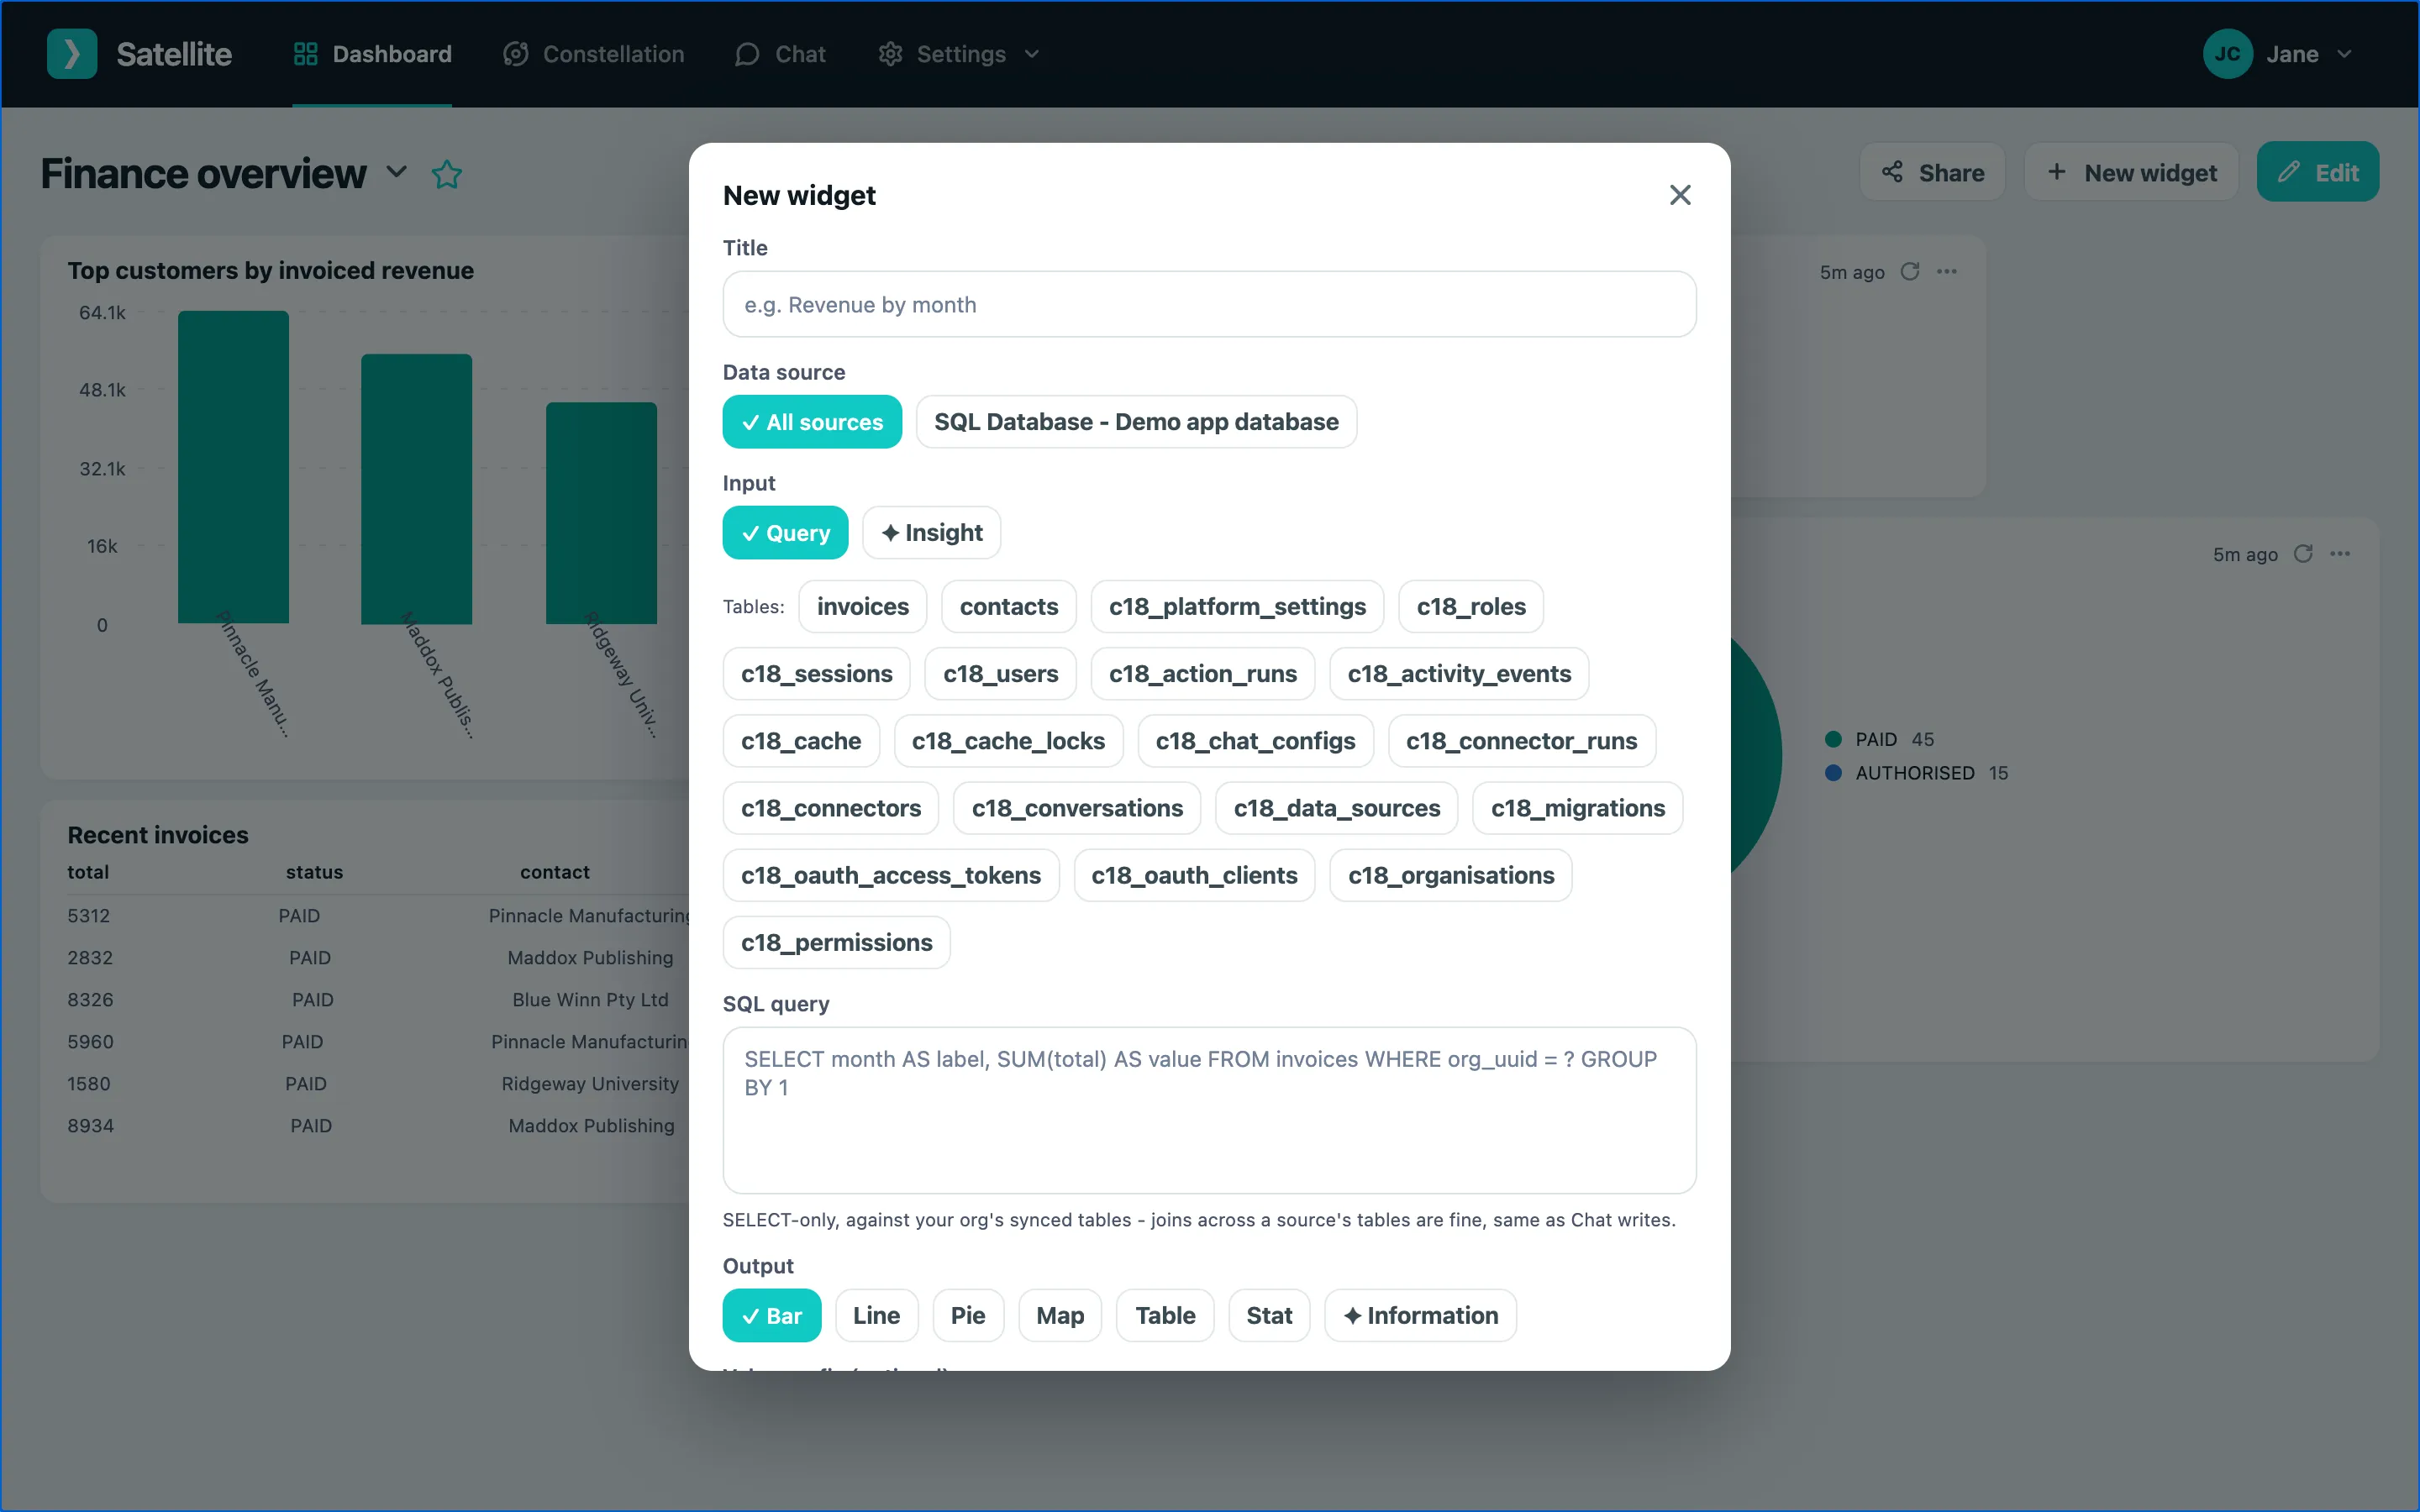
- Pick a type: bar, line or pie chart, map, table, a single stat, an AI insight (a written answer to a standing question), or info (rows laid out by the AI to your instructions).
- For SQL-based widgets pick the data source and write or paste the query. Charts must return two columns named
labelandvalue; maps alocation(orlatandlng) plusvalue. - For insights, write the question the AI should answer each refresh.
- Set the refresh interval and click Save.
The Data explorer (Settings → Data explorer) is a good place to build and test a query first.
Your primary dashboard
Section titled “Your primary dashboard”Click the star next to a dashboard’s name to make it the one that opens first. Each person has their own primary.
Switching dashboards
Section titled “Switching dashboards”The switcher at the top left lists every dashboard you own or that has been shared with you.